In November 2016 I felt something in the air…my gut told me it was time for the blockchain sector to finally have its moment. After playing around with cryptocurrencies for years it was the Ethereum launch that seemed to catapult this sector from a small network of crypto geeks into a larger pool of technology enthusiasts and investors looking to be part of web 3.0 – the decentralized internet. Continue reading →
Posted in Uncategorized on May 17, 2017 by Brit Cruise
For years I struggled to clarify exactly what a Turing machine needs to do, and more importantly, how Turing conceived of it. Even after I finished a CS degree I wasn’t able to “build one from scratch” because I hadn’t yet independently realized what he had…
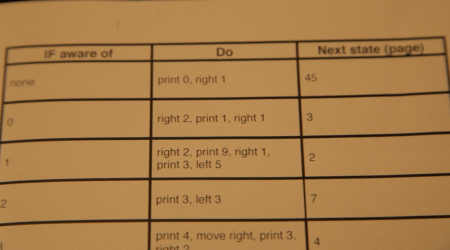
Recently I had a moment of insight and hit on an improved analogy for the “program” of a Turing machine, which Turing describes as “a book”. I took this one step further and clarified that each page in this book can be thought of as a unique state. A page contains a single instruction to follow (which takes the form of a conditional statement). This subtle step is something Turing didn’t include in his paper (instead he skipped ahead and simply refers to it as a ‘big table’, which can be tough to digest at first)
I feel this is the key to make the mechanism behind Turing machines more concrete and intuitive for the new learner. I hope Turing would approve of my modification to his analogy…and after reading his paper some 20 times, I can say with certainty that he would.
Here is the video on how it all works (this is also the 2nd last video in the CS series)
Posted in Uncategorized on November 3, 2016 by Brit Cruise
This video was on the tip of my tongue for years, it feels wonderful to finally move on. It features Aristotle, Leibniz, Adam Smith and Charles Babbage. It’s the main “case study” for this series, after which we’ll move into more modern views on computers and computability.
Posted in Uncategorized on August 29, 2016 by Brit Cruise
Posted a new video this week I’m really happy with. It covers abstraction, deduction & syllogisms through the lens of Aristotle’s work on Logic. Now that this video is complete I can finally get to the real meat of this series…. the dream of a “Universal Computer”. This video also features my son Booker, his second appearance in an Art of the Problem video.
Posted in Uncategorized on May 19, 2016 by Brit Cruise
I’ve seen so many botched, overcomplicated, misconstrued and boring attempts at explaining algorithms to new minds that it was a huge relief to finally finish this video. My goal here is to explain procedural knowledge (know-how) via a thought experiment involving actors. I cover what I consider the two core ideas behind algorithms and where they came from. I also extend the explanation to setup a future video on time/space complexity. You’ll see no mention of while loops, for loops, or bubble sort…horse before cart. This is part 2 in the series on Computer Science.
Posted in Uncategorized on April 6, 2016 by Brit Cruise
This first video explores declarative vs. procedural knowledge through the lens of the Turing Test & Oracle machines. It’s intended to hook + ground the viewer in some basics before building towards Logic & Turing Machines. After this video we will dive deeper into procedural knowledge via. Algorithms. Then we’ll explore more history (arithmetic vs. formal logic) before building towards 20th Century ideas.
Posted in Uncategorized on January 20, 2016 by Brit Cruise
After a long period of research I’m happy to report Art of the Problem’s third episode is in production. This episode will act as the final piece of a CS trilogy. Here is the first video which gives an overview of the series: (or watch on YouTube)
I’ve also published an essay version of this video with extra links below (or read on Medium).
Around 100 years ago something really exciting was happening.
In early 2014 Tony DeRose (Senior Scientist and Lead of the Research Group at Pixar Animation Studios ) and Elyse Klaidman (Director of Pixar University and Archives) approached Khan Academy with an idea. They wanted to answer a question everyone asks in school at some point: “Why do I need to learn this?” Previously, Tony had given talks which try and engage children in mathematics by demonstrating how math lives at the intersection of design and technology at Pixar. It was clear that you could motivate kids to learn math and science by showing them how concepts they encounter in school are used at Pixar to make movie magic…Continue reading →
It wasn’t until 1920 that the question “how do we quantify information” was well articulated. This video introduces a key idea of Nyquist and Hartley, who laid the groundwork for Claude Shannon’s historic equation (Information Entropy) two decades later. In these early papers, the idea of using a logarithmic function appears, something which isn’t immediately obvious to most students fresh to this subject. If one ‘takes this for granted’ they will forever miss the deeper insights which come later. So, the goal of this video is to provide intuition behind why the logarithm was the ‘natural’ choice…
The following video/simulation was an attempt to bridge the gap between information as what we mean to say vs. information as what we could say. I view this as an important stepping stone towards Hartly,Nyquist and Shannon – which I will deal with next. It covers symbols, symbol rate (baud) and message space as an introduction to channel capacity. Featuring the Baudot multiplex system and Thomas Edison’s quadruplex telegraph.
Play with simulations used in video on Khan Academy:
The follow three video mini-series is a bit of an Engineering detour in the story of information theory. In order to easily grasp the ideas of Hartley and Shannon, I felt it would be beneficial to lay some groundwork. It began with my own selfish interest in wanting to relive some famous experiments & technologies from the 19th Century. Specifically, why did the Information Age arise? When and how did electricity play a role in communication? Why was magnetism involved? Why did Morse code become so popular compared to the European designs? How was information understood before words (and concepts) such as “bit” existed? What’s the difference between static electricity and current?
All of these questions are answered as we slowly uncover a more modern approach to sending differences over a distance…
It’s powerful to understand how conditional probability can be visualized using decision trees. I wanted to create an alternative to most explanations which often start with many abstractions. I was drawn to the idea of looking at the back pages of a choose-your-own-adventure book, and deciding how you could have arrived there. Here I present a visual method using a story involving coins… allowing you to decide how to formalize. Once we grow tired of growing trees, we may ask the key questions: how can we speed up this process?:
This is followed by a game I designed (built by Peter Collingridge) which introduces how branches can be weighted instead of counted.
In order to understand the subtle conceptual shifts leading to the insights behind Information Theory, I felt a historical foundation was needed. First I decided to present the viewer with a practical problem which future mathematical concepts will be applied to. Ideally this will allow the viewer to independently develop key intuitions, and most importantly, begin asking the right kind of questions:
I noticed the viewer ideas for how to compress information (reduce plucks) fell into two general camps. The first are ways of using differentials in time to reduce the number of plucks. The second are ways of making different kind of plucks to increase the expressive capability of a single pluck. Also, hiding in the background is the problem of what to do about character spaces. Next I thought it would be beneficial to pause and follow a historical narrative (case study) exploring this problem. My goal here is two congratulate the viewer for independently realizing a previously ‘revolutionary’ idea, and at the same time, reinforcing some conceptual mechanics we will need later. It was also important to connect this video to previous lessons on the origins of our alphabet (a key technology in our story), providing a bridge from proto-aphabets we previously explored….
This is followed by a simulation which nails down the point that each state is really a decision path
Before jumping into Information Theory proper I decided to go back and explore the history of the Alphabet. This reminds us that communication, no matter how fluid it seems, is really just a series of selections. I’m using both Shannon and Harold Innis as inspiration for this series which is why I’m clarifying medium vs. message as well as information transmission over space vs. time – ideas which are popularized by Marshall McLuhan years later. By starting this way I’m able to carefully move away from the semantic issues of information and towards what Shannon called the “engineering problem”. This analogy will carry through the rest of the series so it’s important to lay the groundwork early on.